Note: At any time during a MATLAB session you may type help COMMAND for MATLAB's internal information on how COMMAND may be used, including examples. If you do not know what command you are looking for, you may type lookfor SUBJECT to get MATLAB to search for commands which refer to your SUBJECT.
EXERCISE 1: Type
help linspace
and after reading about linspace type
lookfor space
to see what other relevant commands there might be.
Let's begin by graphing some familiar one-dimensional functions using MATLAB . The first step is to make a vector corresponding to the real axis, say between -5 and 5:
x = linspace(-5,5,101);
The above command generates a vector with 101 components, named `x', whose
elements are evenly spaced numbers beginning at -5 and ending at 5. The
semicolon (;) suppresses output - try the command without it and see what
happens! Notice also that we get a spacing of
Now define a function,
![]() , which we will then plot. The
function
, which we will then plot. The
function ![]() will be a vector, f, which contains for every component of the
coordinate vector, x, a value according to the rule
will be a vector, f, which contains for every component of the
coordinate vector, x, a value according to the rule ![]() :
:
f = sin( x.^2 )./(1 + x.^2);
The notation `.' before an operation means to apply the operation
element-by-element to an array; thus
x.^2
means the element by element square of x, or a vector of length 101 with
values
plot(x,f)
which will plot the ordered pairs given by x,f. Try changing the order of x
and f above to see what happens.
Now, to see how to put multiple plots on one graph and change some of the styles, try the following:
     plot(x,f,'r*')
     hold on, plot(x,1./(1+x.^2),'g'), hold off
     xlabel('x'),ylabel('f(x)'),title('Function and Envelope')
The `hold' commands force MATLAB to draw plots without erasing previous plots. One may also plot several functions simultaneously, as in
     figure(2)
     plot(x,cos(x),'r',x,exp(-abs(x)),'b',x,sin(x.^2),'g')
Now, just to see what some of the options would be, type
help plot
which will give you a number of examples, sets of options, and some suggestions for other commands you might find useful. Try some of these just to get the hang of it.
EXERCISE 2: Plot the
fundamental solution of the heat equation,
Defining functions of two variables works with the same philosophy in MATLAB , except that the underlying substrate of independent variables becomes a matrix as opposed to a vector. Let's begin by defining two coordinates, x and y and then a two-dimensionally extended version of these coordinates:
     x=.1*[0:100];
     y=.05*[-50:50];
     [X,Y]=meshgrid(x,y);
(Notice the scalar multiplication of a spacing, either .1 or .05 above, and an
array of numbers, [N1:N2], which is all of the integers between N1
and N2, inclusive. Thus, x=.1*[0:100] is equivalent to x=linspace(0,10,101).).
Now we may define a function of these two variables analogously to the one-dimensional procedure. For example, to plot the function
     g = sin(X.^2+pi*Y)./(1+X.^2+Y.^2);
     surf(X,Y,g)
Can you tell which is the
surf(X,Y,g),shading flat
The shading flat option removes the grid lines and shades each portion
of the graph as a flat polygon. You can change the color mappings by trying
things like colormap hot, and on a computer screen things are more
striking if you issue the command whitebg('k') (which makes the
background color black, or 'k'). To see a particular slice of the
graph, that is a section in either the x or y direction, you can
plot a particular row or column of g. For example, to plot a cross
section in
the
figure(2),plot(x,g(1,:))
The colon (:) in the second argment of g says `all available indices,' and in
this case `g(1,:)' means `From the matrix g take the first row and
all columns,' which is, of course the vector containing samples taken from
g in the x direction at the smallest y value (which has
index 1). Use hold on, hold off to plot some other cross sections of
the function until you feel comfortable with which indices correspond to which
variables.
Now let's plot contours and densities in another window. Try
figure(3), pcolor(X,Y,g), shading flat, colormap hot
This will create a new figure, put a density plot of g in it, and
color-code the densities in such a way that lower values are dark (cool) and
higher densities are white (hot). It is possible to super-pose contours on
this graph:
hold on, contour(X,Y,g,'b'), hold off
This will place 20 aesthetically chosen contours in blue on the color density plot.
EXERCISE 3: The function
One of the nice features of MATLAB is the existence of logical matrices, which
are just arrays with elements that are either zero or one depending on whether
a statement is true or false. Let's return to x and f given in
the first section above. Re-input these into MATLAB (remember ![]() !) and
now let's manipulate using logical matrices. For example, suppose that we
would like to plot only the positive portions of f. Define
!) and
now let's manipulate using logical matrices. For example, suppose that we
would like to plot only the positive portions of f. Define
fplus=( f>=0 );
The array fplus is exactly as long as f (that is 101 elements) but
contains zeros where f
plot(x, f, 'y', x, fplus.*f, 'ro')
By multiplying f and fplus element by element we have created a new
entity which is the positive part of f where f is positive and
zero where f is negative. If we wanted to show the negative part of
f in little blue triangles on the same graph, we could
hold on, plot(x, (1-fplus).*f,'b^'),hold off
These logical matrices can also be used to create piece-wise functions, which
we will see next.
Suppose you wanted to make a function ![]() which was Gaussian for two standard
deviations (
which was Gaussian for two standard
deviations (![]() ), and then uniform (with value
), and then uniform (with value ![]() ) for two
standard deviations, and then zero, and then that you wanted to re-normalize
it so that the resulting function still represented a probability density
function (pdf). Pick a standard deviation of .5; a normal pdf with standard
deviation .5 is given by
) for two
standard deviations, and then zero, and then that you wanted to re-normalize
it so that the resulting function still represented a probability density
function (pdf). Pick a standard deviation of .5; a normal pdf with standard
deviation .5 is given by
     x = 6/100*[-50:50];
     N = sqrt(2/pi)*exp(-2*x.^2);
Now we need logical matrices for the different portions of the pdf we are
building. These we will call `norm' and `uni,'
     norm=(abs(x)<=1);
     uni=(abs(x)>1 & abs(x)<=2);
The MATLAB command abs(x) returns the absolute value of x; the
statement `(abs(x)<=1)' tests whether or not the absolute value of x is smaller or equal to 1, returning the value `1' if it is, and `0' if it
is not.
The arrays norm and uni will thus contain only ones where the pdf will be
normal and then uniform, respectively. Now we can create a vector, pdf,
which
will have the proper shape but will not have unit integral:
pdf=N.*norm + sqrt(2/pi)*exp(-2)*uni;
You should plot this to see that it is correct. Finally we must normalize. We have defined a grid with spacing 6/100=.06, so a quick approximation of the actual integral would be
mass=.06*sum(pdf)
The command sum adds up all the elements of a vector input, so that the
above is equivalent to a simple Reimann-sum approximation to the integral.
A better approximation would come from the trapeziod rule
mass=.06*trapz(pdf)
which sums the average value in each cell.
Now we can normalize,
pdf=pdf/mass;
Now plot this. You can use up-arrows to just find the command you used last
time, or you can compare it to the previous (unnormalized) function by using
hold on and hold off.
EXERCISE 4: A function which we will see again in dispersal is the steady-state
solution to the diffusion-loss model with a localized source at the origin,
![\begin{displaymath}
F(x) = \frac{\alpha}{2 \sqrt{D \lambda}} \exp\left[ -\sqrt{\frac{\lambda}{D}}
\vert x\vert
\right].
\end{displaymath}](img30.gif)
Now that you have a MATLAB basis, you might find it useful to tour through some of MATLAB 's cababilities using demos. The demos are a set of GUI slide shows which illustrate various MATLAB functions. So, on the command line type
demos
and a window should pop up on screen with a variety of MATLAB subjects. To get
comfortable with the demos and see some of how MATLAB handles linear algebra
click on Matrices in the left hand window, followed by Basic matrix
operations in the right hand window, and then Run Basic matrix... on
the lower-right hand corner button. A new window will appear (the Slideshow Player) which you can use then to page through slides which
illustrate various MATLAB matrix operations, which are useful to know. You can
actually type the commands appearing in the slide show in your command window
to see how they work, which is probably the best way to learn. Pay
particular attention to how to set up matrices and find eigenvalues.
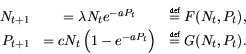
EXERCISE 5: The Nicholson-Bailey model for host-parasite interactions is
In the rest of the course we will be using the Fast Fourier Transform (FFT) to evaluate the consequences of dispersal. You can use the demos facility to start learning about FFTs and their implementation in MATLAB . To begin with, click Numerics in the left-hand window and then Fast Fourier Transform in the right hand window, followed by clicking on Run Fast Fourier... on the button in the lower right hand corner. You can now page through slides which illustrate how one can use the FFT to analyze sunspot data. I suggest typing
help fft
first to get a idea of what the FFT is all about, if you have never used
Fourier transforms for data analysis. We will be using FFTs a lot, so don't
despair if these seem a little cryptic just now. Remember, if you want to see
what any of the component commands in the demo do, you can always type help SUBJECT in the command window and it will almost certainly give you
either no information or more information than you really need.
Congratulations! You have `jumped in the deep end' with MATLAB , but you didn't sink!